HomeInsightsFood Decarb Series › Pathways
Food Decarb Series · Pathways
Food & BeverageMACC · Biogas · Heat PumpsGated · June 2026

Food Industry Decarbonization Pathways

Process emissions, capital sequencing, and a five-KPI screening framework for food and beverage manufacturers — three reference plants, five lever families, a marginal abatement cost curve, and two worked case studies with full financing math.

By Koorosh Behrang · Founder, Climate Decode · · The full report

BIOGAS + TRIGEN · LAYERED MAC (CAD/t)$215Plain$159+ITC$127+OBPS−$22+CFRStack the policy layers → the project clears.
Reference plants
3 plants
dairy, meat & potato — fully modelled
Decarbonization levers
5 families
from energy efficiency to geothermal
Worked case studies
2 cases
biogas & heat pumps, full math
Pathways · The Report

What's inside

Food and beverage processing is heat-dominant, fragmented across eight to ten sub-sectors, and under-mapped relative to steel or cement. This report sets out the decarbonization toolkit in operational, not aspirational, terms — connecting plant-level energy data to an emissions baseline, then to a marginal abatement cost (MAC) curve, then to a financing plan that captures every available revenue layer.

Through two worked case studies it shows exactly how operating-cost savings, tax credits, fuel-side credits and carbon-price revenue combine to determine which projects clear an investment committee — and why the order in which levers are deployed matters more than the headline carbon price.

Full contents

  • 01State of the Sector
  • 02Production Processes & Hotspots
  • 03Three Reference Facilities
  • 04Decarbonization Solutions (five families)
  • 05Why Marginal Abatement Cost Is Not Sufficient
  • 06Carbon Markets & the Policy Stack
  • 07Case Studies (biogas + heat pumps)
  • 08How TerraNova Helps & Conclusions

A sample from inside

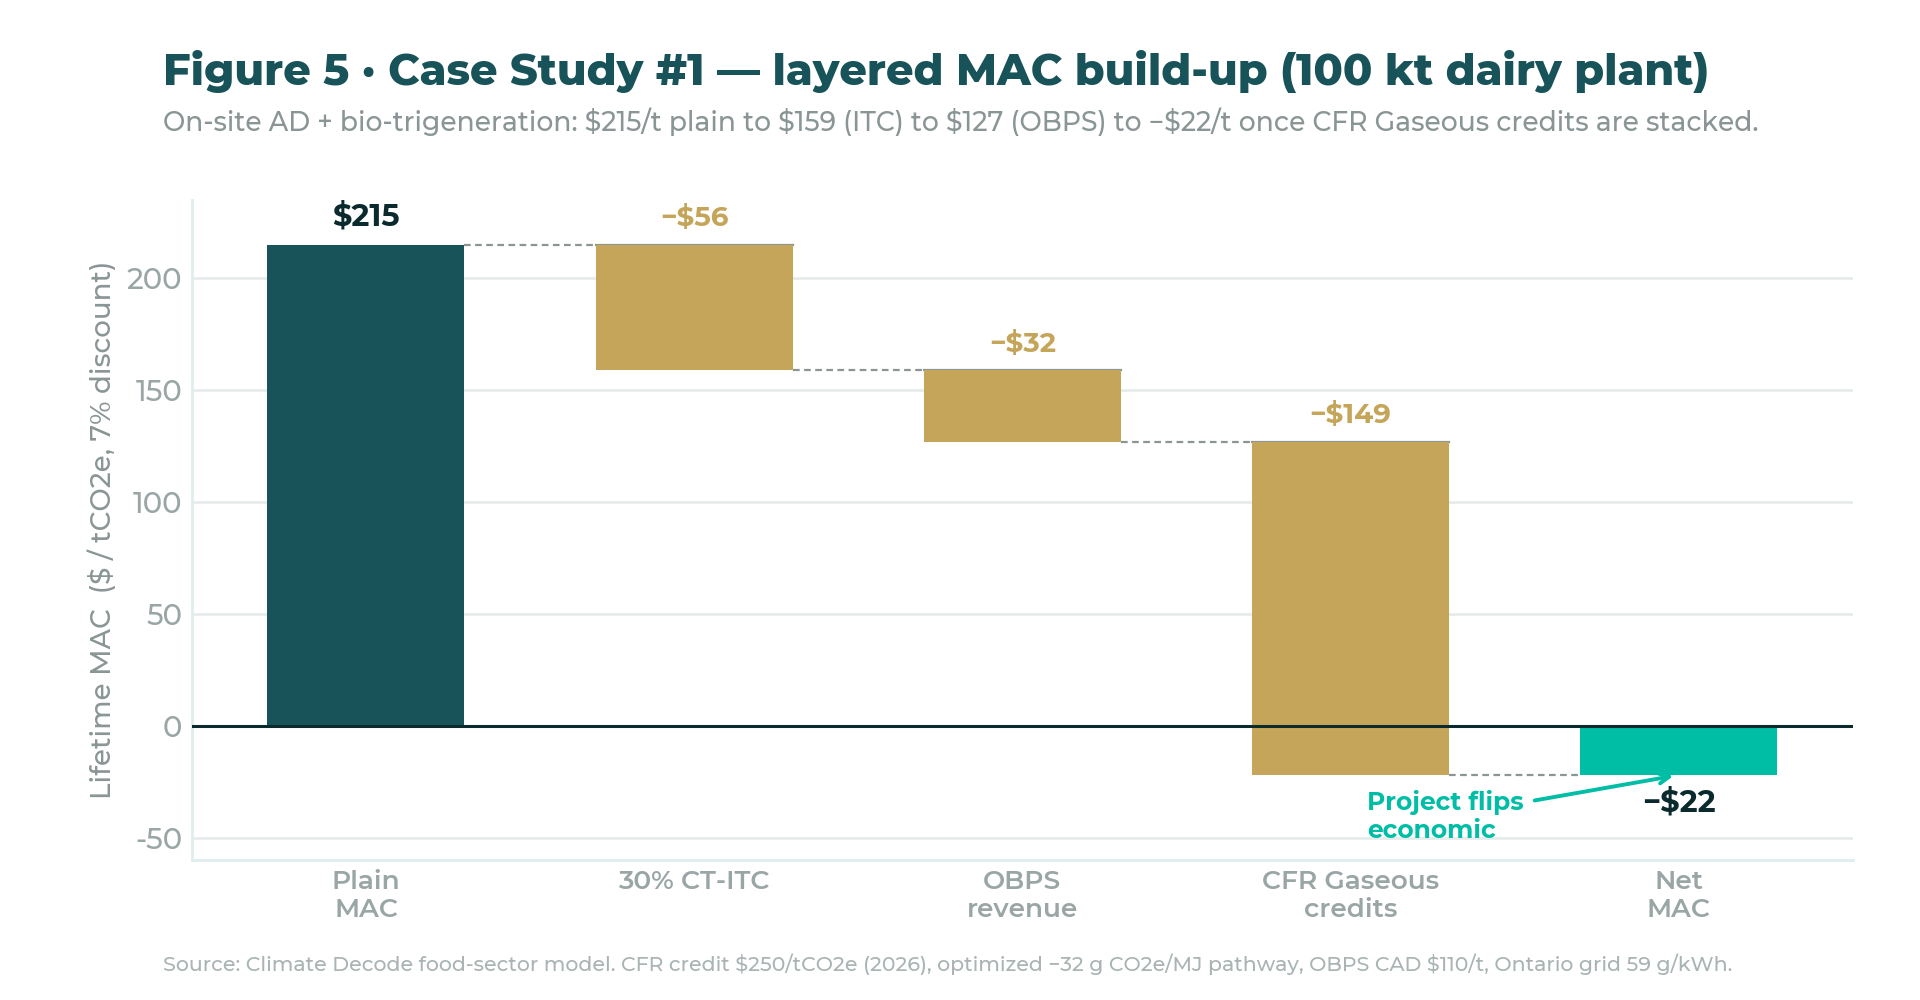
Case 1 — on-site anaerobic digestion + bio-trigeneration at a 100 kt dairy plant: the plain MAC of CAD $215/tCO₂e falls to a net −$22/tCO₂e once the 30% Clean Technology ITC, OBPS carbon-price revenue and CFR Gaseous Class credits are stacked on an optimized −32 gCO₂e/MJ lifecycle pathway. The full report shows every layer, the sensitivity grid, and the conditions that make it bankable.

Sample figure from the report: on-site biogas layered marginal abatement cost build-up
A sample figure from Section 7 — the Case Study 1 layered MAC build-up. The full report includes seven figures and the complete data tables.
Free · Gated download

Get the full report

Enter your details to access the complete Pathways report — all the figures, the full MAC build-ups, the lever catalogue, the five-KPI matrix, and both case studies.

  • Five lever families, fully characterised
  • Two case studies with layered MAC math
  • Carbon-market & tax-incentive tables
  • The five-KPI screening matrix

No spam. Unsubscribe anytime. By submitting you agree to our privacy policy.

Executive Summary

The Argument in Brief

Where the emissions sit

The two case studies, in one line each

On-site biogas + bio-trigeneration at a 100 kt dairy plant moves from a plain MAC of CAD $215/tCO₂e to a net −$22/tCO₂e once the 30% Clean Technology ITC, OBPS revenue and CFR Gaseous Class credits are stacked on an optimized lifecycle carbon intensity — and loses money without a registered CFR pathway. An industrial heat pump + hybrid condenser at a 90 kt meat plant lands at a net MAC of $72/tCO₂e on Quebec's clean grid but $285/tCO₂e in Saskatchewan, because the Scope-2 penalty on a coal-heavy grid erodes the gas savings.

The recurring finding

The binding constraint is rarely the technology, and rarely the headline carbon-price level — it is the order in which levers are deployed and the multi-year readability of the full revenue stack to a capital-allocation committee. Sequence efficiency first, low-temperature electrification second, biogas third, strategic plays fourth; reverse that order and 20–30% of cost-effective abatement is stranded.

For how this maps onto a validated science-based target, see the companion SBTi target-setting briefing for food and beverage.

TerraNova by Climate Decode

The whole workflow in this report, in one platform.

TerraNova ingests facility operations data, allocates emissions to each process step, screens more than fifty levers against the local policy stack, and returns a finance-grade investment plan — ranked portfolio, deployment schedule, NPV/IRR by lever, and year-by-year compliance position.

Explore TerraNova →Request a Demo
Continue in the Food Decarb Series

SBTi Target Setting for Food  ·  Food Decarb Series index  ·  Decarb Series (Pulp & Paper)

Koorosh Behrang
Written by

Koorosh Behrang

Founder, Climate Decode · Industrial Decarbonization & Carbon Markets

Founder of Climate Decode with more than 10 years across decarbonization strategy, corporate sustainability, Net Zero target setting, and compliance carbon markets. Leads the development of TerraNova — Climate Decode's platform for emissions baselines, marginal abatement cost curves, and finance-grade project economics.

Meet the team →

Build your plant's decarbonization investment plan.

TerraNova turns food and beverage operations data into a finance-grade roadmap — emissions hotspots, a marginal abatement cost curve, NPV/IRR by lever, and policy-aware economics across every revenue layer.