HomeInsightsFood Decarb Series › SBTi Target Setting
Food Decarb Series · SBTi Briefing
Food & BeverageFLAG · Net-Zero StandardTarget Setting

SBTi Target Setting for Food & Beverage

Combining corporate energy-and-industry targets with FLAG — a practitioner summary for food and beverage processors. What each target is, how the two interact, and what it takes to get validated.

By Koorosh Behrang · Founder, Climate Decode · · 10 min read

TWO TARGET STREAMSEnergy & industry · 4.2%/yrFLAG · 3.03%/yr20202030Set both. Validated separately. Never netted against each other.
Scope 3 share
85–95%
of the corporate footprint, mostly ingredients
Energy & industry
4.2%/yr
cross-sector absolute, Scope 1+2 near-term
FLAG sector
3.03%/yr
for diversified land footprints
In This Article
Section 1

Why This Matters for Food & Beverage

Food and beverage sits across two emissions worlds, and the gap between them is wider than for almost any other sector. The plant side burns fossil natural gas in package and process boilers, runs ammonia and HFC refrigeration, draws purchased electricity from the grid, and operates on-site equipment — conventional energy-and-industry emissions that the Science Based Targets initiative (SBTi) treats under its Corporate Net-Zero Standard. The ingredient side reaches back into farms, ranches, plantations and fisheries, where enteric methane, manure management, fertilizer-induced nitrous oxide and land-use change drive a different category — the Forest, Land and Agriculture (FLAG) emissions that have their own SBTi pathway and their own rules.

For most food and beverage companies the FLAG side is the larger of the two, often by an order of magnitude. Industry-average disclosures put Scope 3 at 85–95% of total emissions, with the bulk in purchased ingredients — raw milk, beef, pork, poultry, palm oil, soy, wheat, maize, sugar, cocoa and coffee. Because both sets of emissions are material, SBTi explicitly requires food and beverage processing companies to set both a FLAG target and an energy-and-industry (non-FLAG) target.

The one-line rule

The two targets are accounted for and validated separately, but together they form the company's full science-based commitment. The energy-and-industry side leans on the abatement toolkit in our food decarbonization Pathways report; the FLAG side leans on agricultural and land-management interventions upstream of the factory gate.

Where a food company footprint sits: Scope 1 plus 2 about 10 percent, Scope 3 FLAG ingredients the bulk, Scope 3 other the remainder
Figure 1 — for most food and beverage companies Scope 3 is 85–95% of the footprint, and purchased ingredients (FLAG) are the bulk of it.
Section 2

SBTi Corporate (Energy & Industry) Targets

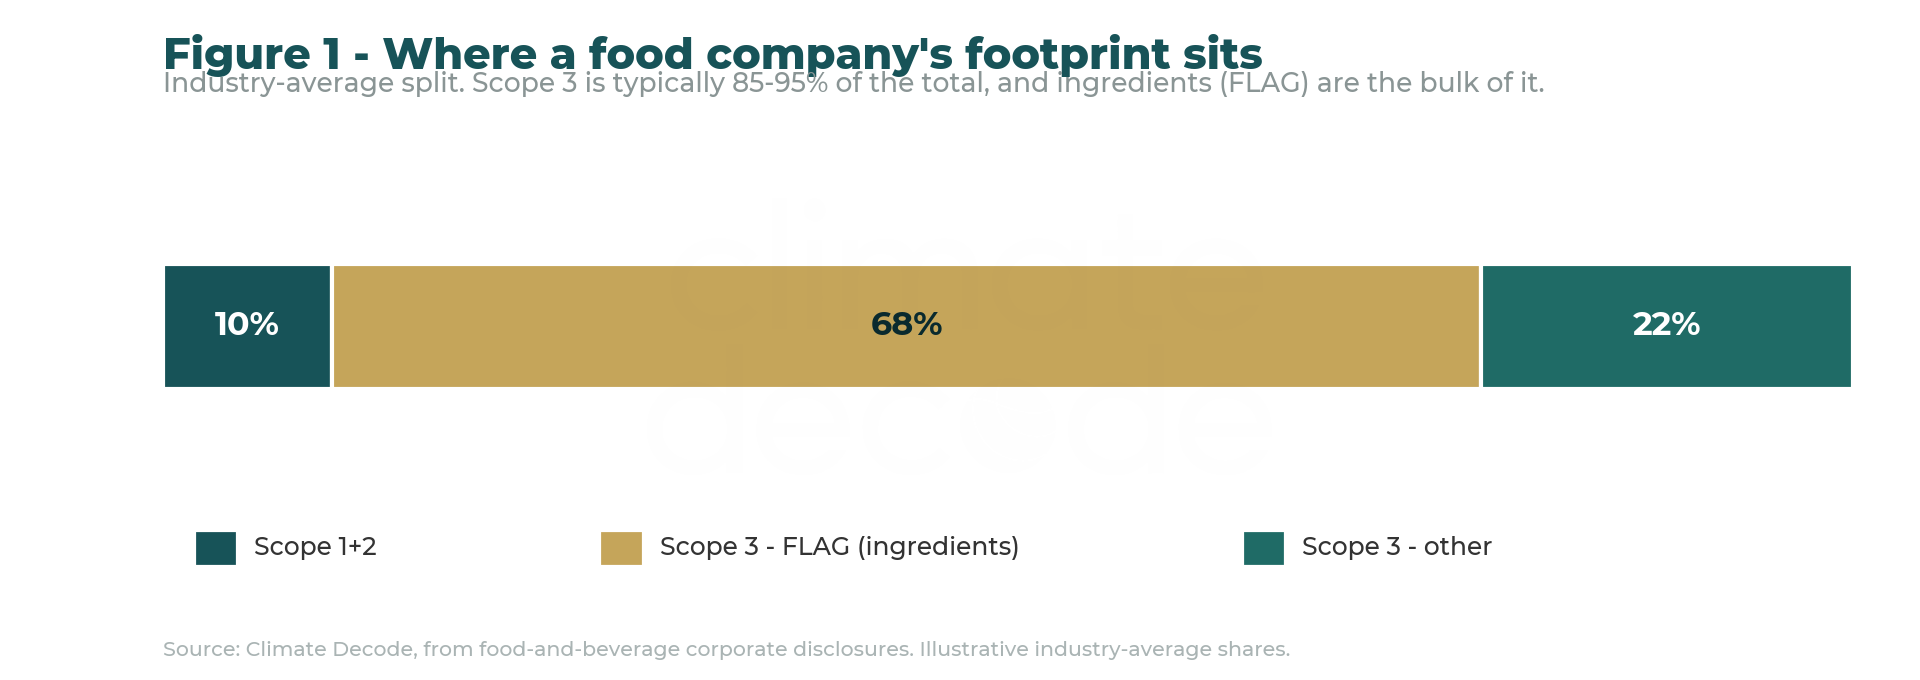
The SBTi corporate framework asks companies to commit to two layers of targets: a near-term target with a 5-to-10-year horizon, and a long-term net-zero target with a 2050 horizon. Both cover Scope 1 and Scope 2. Near-term Scope 3 targets are required only when Scope 3 is 40% or more of total Scope 1+2+3 (67% minimum coverage); long-term Scope 3 targets are required for every company (90% minimum coverage). For almost every food and beverage company the 40% threshold is comfortably exceeded, so a near-term Scope 3 target is mandatory in practice.

2.1 Near-term targets

Near-term Scope 1+2 targets must align with 1.5°C and be achieved within 5 to 10 years of submission. The default cross-sector absolute contraction approach (ACA) requires a minimum linear reduction of 4.2% per year from the base year. Scope 1+2 boundaries must cover at least 95% of combined Scope 1+2; for Scope 2, SBTi additionally requires renewable-electricity procurement of 80% by 2025 and 100% by 2030. Where required, near-term Scope 3 targets must cover at least 67% of Scope 3 — and FLAG-related Scope 3 sits in a separate sub-target with its own pathway, never netted against the non-FLAG target.

2.2 Methods — type of target, then Scope 2 and Scope 3

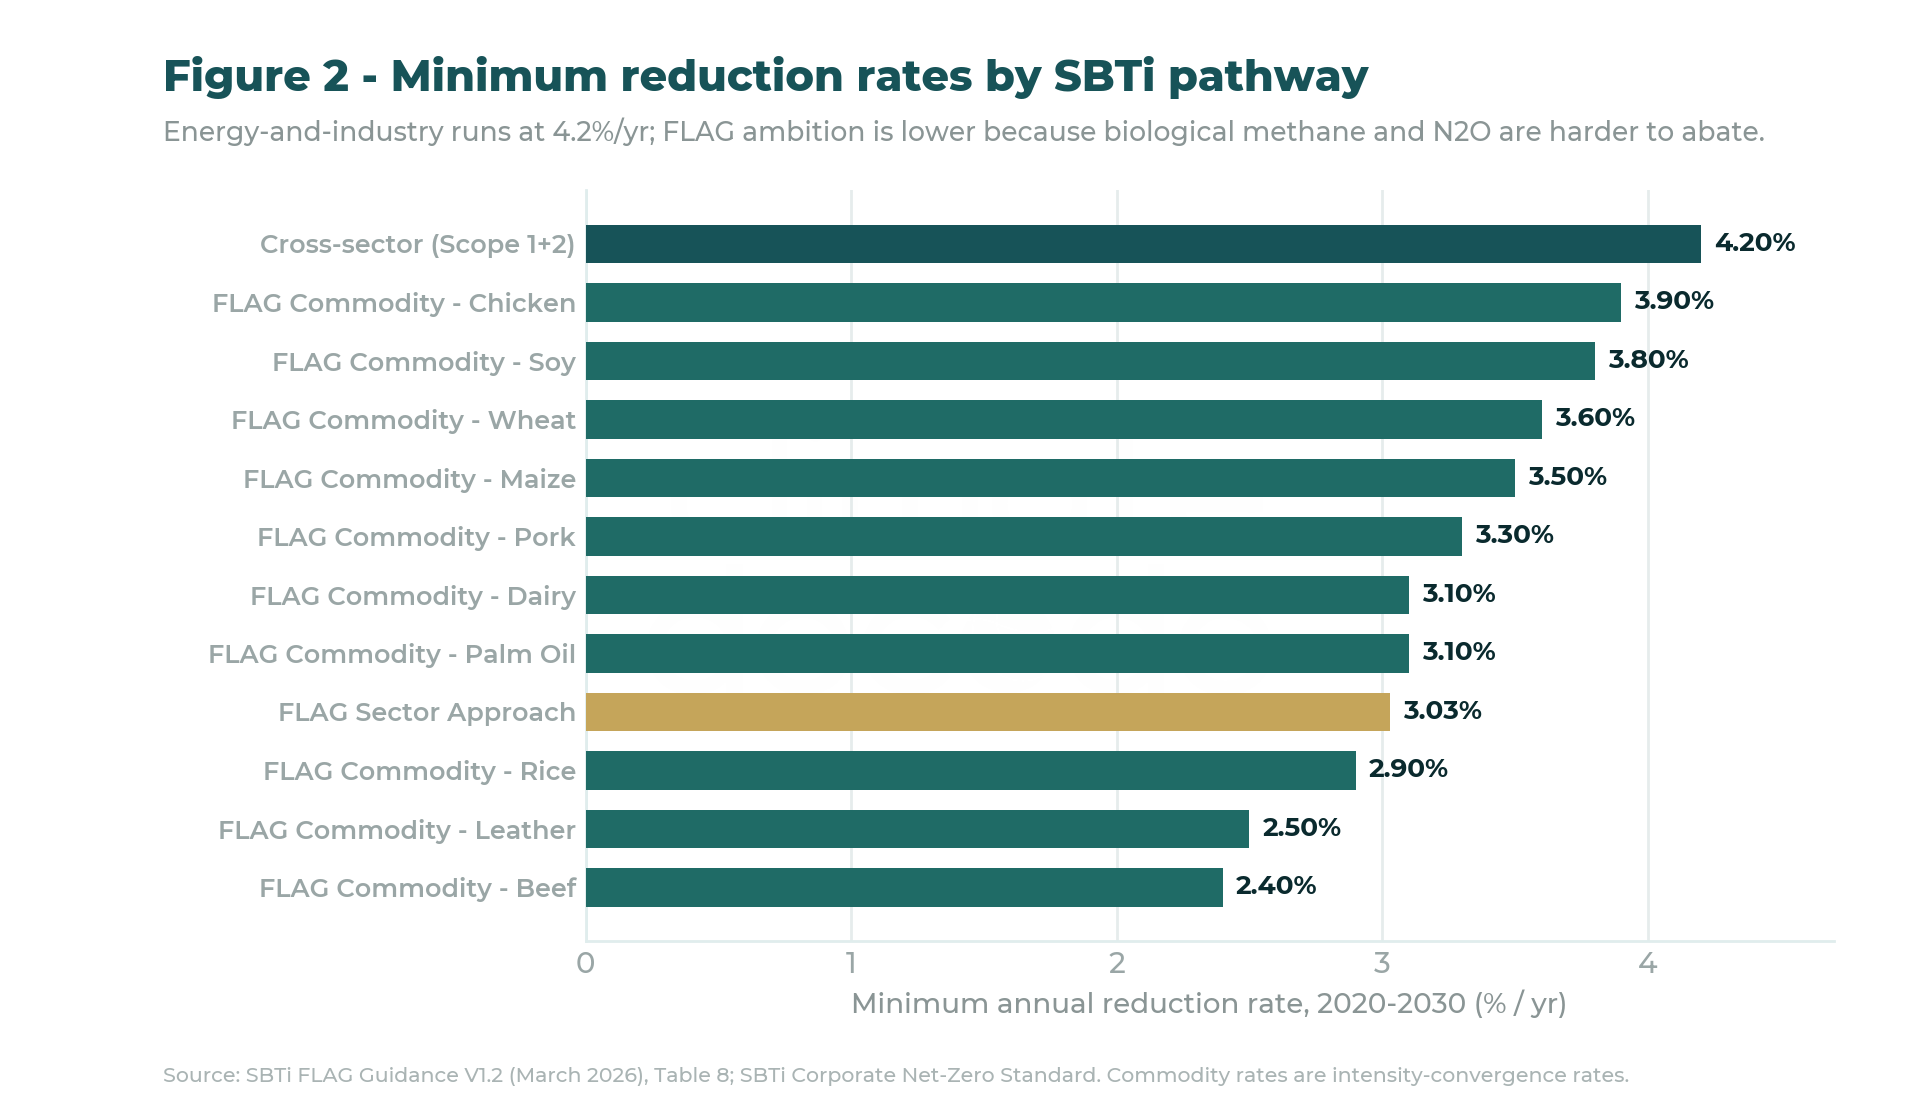
Type of target. Two families exist. The cross-sector ACA sets a fixed absolute rate (4.2%/yr near-term, ~90% by 2050) regardless of activity. The Sectoral Decarbonization Approach (SDA) is sector-specific intensity convergence, required where a finalised SBTi sector standard exists (iron & steel, cement, buildings, power, FLAG, automaker). Food and beverage processing has no finalised SDA, so the energy-and-industry side defaults to ACA at 4.2%/yr.

Scope 2. SBTi accepts a renewable-electricity method (Annex B.4): 80% renewable electricity by 2025 and 100% by 2030, via RECs or virtual PPAs. For refrigeration-heavy dairy, beverage, frozen-storage and bakery sites with large baseload, this is the natural Scope 2 method.

Scope 3 (non-FLAG). Packaging, chemicals, capital equipment, transport, distribution, retail refrigeration and end-of-life can use physical intensity (Annex B.5, minimum 7%/yr), economic intensity (Annex B.6), or supplier/customer engagement (Annex B.7) — the last being the most common route for packaging converters, logistics providers and retail customers.

Scope 3 (FLAG). Purchased raw milk, livestock, grains, oils, sugar, cocoa and coffee sit in the FLAG target, not the energy-and-industry target, set through the SBTi FLAG Tool. Most companies trigger several commodity pathways at once; where no single commodity dominates, the FLAG sector pathway (3.03%/yr) can be used. FLAG and non-FLAG Scope 3 are validated as separate sub-targets.

2.3 Long-term net-zero targets

Long-term targets align with 1.5°C and a target year no later than 2050, with coverage of at least 95% of Scope 1+2 and 90% of Scope 3. The end state is an absolute reduction of approximately 90% across all scopes, with any small residual neutralised by durable carbon dioxide removals. One asymmetry: the cross-sector pathway carries the energy-and-industry side cleanly to 2050, but several FLAG commodity pathways do not yet have a published long-term track — companies must footnote those exclusions and resubmit within six months of SBTi releasing the missing pathway.

2.4 Biogenic emissions and bioenergy accounting

Food and beverage is one of the more biogenic-fuel-capable industrial sectors — anaerobic digestion of dairy lagoon manure, wet-cleaning effluent, brewery spent grain, bagasse and processing residues generates biogas that substitutes for natural gas. Under most compliance regimes (OBPS, EU ETS, WCI) this biogenic CO₂ is zero-rated. Under SBTi the rule differs: Section 4.3.3 and criterion C11 require bioenergy users to include direct CO₂ from biomass combustion, processing and distribution — plus the land-use emissions and removals of the feedstock — inside the SBTi target boundary.

The defensible biogenic position

On-site anaerobic digestion of own-process waste is the most defensible position: the feedstock is a process residue with no land-use change, the carbon is short-cycle biogenic, and the substitution against natural gas is a real Scope-1 reduction inside the SBTi boundary. Purchased biogas, pellets or solid biomass with upstream land-use exposure must be traced and reported with full FLAG accounting attached.

2.5 Validation and review

Targets are submitted through the SBTi Validation Portal, validated against the published criteria, and published. Companies report a company-wide inventory and progress annually, and review targets at least every five years. Material changes in boundary, base year, structure (M&A) or methodology can trigger a recalculation — food and beverage companies reshaping their portfolio should expect to recalculate the base year and re-validate.

Cost the energy-and-industry side

The energy-and-industry target is delivered through real abatement at the plant — efficiency, electrification, biogas and heat pumps. Our Pathways report costs every lever on a five-KPI screen. Get the Pathways report →

Section 3

SBTi FLAG — Forest, Land and Agriculture

FLAG is SBTi's dedicated framework for emissions and removals from land use, land-use change and land management — the parts of a corporate footprint that energy-and-industry pathways are not designed to handle: enteric and manure methane, fertilizer nitrous oxide, deforestation CO₂, soil-carbon losses, and the removals that improved cropland management, agroforestry and restoration can deliver.

3.1 Who is required to set a FLAG target

Under criterion FLAG-C1, a company must set a FLAG target if it is in an SBTi-designated FLAG sector — Forest and Paper Products; Food Production (Agricultural and Animal Source); Food and Beverage Processing; Food and Staples Retailing; Tobacco — or if FLAG emissions are 20% or more of total Scope 1+2+3. Food and beverage processing is a designated sector, so the requirement attaches to a company's position in the food value chain, not to ownership of land or animals. A vertically integrated processor carries on-farm emissions in FLAG Scope 1 plus purchased ingredients in FLAG Scope 3; a pure processor carries the entire FLAG burden in Scope 3.

3.2 The two FLAG pathway options

FLAG offers an absolute sector approach (for diversified footprints) and an intensity-convergence commodity approach with eleven tracks. Under criterion FLAG-C7, any input at 10% or more of FLAG emissions must use its commodity pathway. There is no published commodity pathway today for cocoa, coffee, sugarcane, fruit, vegetables or fish, so those sit in the sector approach. Most large companies trigger several tracks at once — a dairy processor on dairy; a meat processor on beef, pork and chicken; a chocolate manufacturer on dairy and palm with cocoa and sugar in the sector approach.

3.3 No-deforestation commitment

Every FLAG target carries a mandatory no-deforestation commitment (criterion FLAG-C4) for primary deforestation-linked commodities. The target date is no later than two years after FLAG submission and not later than 31 December 2030; the cutoff date should be no later than 2020, aligned with the Accountability Framework initiative. For food and beverage the highest-risk commodities are palm oil, soy, beef and cocoa — and EU Deforestation Regulation (EUDR) traceability operationalises the SBTi commitment and satisfies both regimes at once.

3.4 Emissions, removals, and accounting boundary

FLAG covers land-use change (deforestation, peatland and ecosystem conversion), land-management emissions (enteric methane, manure, fertilizer N₂O, rice methane, urea and lime CO₂) and land-management removals (restoration, agroforestry, improved grazing, cover cropping, reduced-till).

Two accounting rules that drive strategy

First, FLAG and energy/industry targets are kept separate — emissions and removals from one cannot be netted against the other. Second, removals cannot substitute for reductions inside FLAG: in the FLAG sector pathway, reductions account for about 62% of the mitigation potential and removals about 38%. Plan to it — it requires real on-farm intervention, not credit purchases.

Section 4

Why Food & Beverage Must Set Both

Setting only an energy-and-industry target would miss the upstream agricultural emissions, where 85–95% of the footprint sits. Setting only a FLAG target would leave the plant, the grid, the cold chain and the rest of the energy footprint out of the commitment. SBTi requires both, validates them separately, and publishes them as two distinct sub-targets.

4.1 What sits in which target

Emission sourceTarget bucketMethod
NG boiler, dryer, fryer, oven; mobile dieselEnergy & industry (Scope 1)Cross-sector absolute contraction
Purchased grid electricity (refrigeration, drives)Energy & industry (Scope 2)Cross-sector ACA + renewable-electricity target
Refrigerant leakage (HFCs, ammonia loops)Energy & industry (Scope 1)Cross-sector absolute contraction
Own-process anaerobic-digestion biogasEnergy & industry (Scope 1), per C11Reported inside the SBTi boundary
On-farm enteric methane, manure, fertilizer N₂OFLAG (Scope 1)Commodity pathway or FLAG sector approach
Land-use change on owned/contracted landFLAG (Scope 1)Commodity pathway or FLAG sector approach
Purchased ingredients (milk, livestock, grains, oils, sugar)FLAG (Scope 3)Commodity pathway (≥10% of FLAG); sector approach for the long tail
Soil-carbon & agroforestry removalsFLAG removals (separate line)Reported separately; cannot net against reductions
Purchased packaging (glass, PET, aluminium, board)Energy & industry (Scope 3)Cross-sector ACA, engagement, or physical intensity
Transport, distribution, retail refrigerationEnergy & industry (Scope 3)Cross-sector ACA, engagement, or physical intensity

Note: ‘Energy and industry’ is the non-FLAG boundary; ‘FLAG’ is the Forest, Land and Agriculture target. The two are validated separately and cannot be netted. On-process biogas is treated under C11 — the CO₂ is reported inside the SBTi boundary even though it is biogenic and zero-rated under most compliance regimes.

4.2 Ambition — the two pathways do not have the same rate

Land-sector decarbonisation is constrained by persistent biological methane and nitrous oxide sources that are harder to abate than fossil combustion, so FLAG ambition is set below the cross-sector rate. Commodity pathways converge to a global per-tonne intensity in 2030; the company-specific absolute reduction is calculated in the SBTi FLAG Tool from the company's own baseline intensity.

Minimum annual reduction rates by SBTi pathway: cross-sector 4.2 percent, FLAG commodity rates 2.4 to 3.9 percent, FLAG sector 3.03 percent
Figure 2 — minimum reduction rates by pathway, 2020–2030. The energy-and-industry side runs faster (4.2%/yr) than every FLAG track.
PathwayTypeMin. rate (%/yr 2020–2030)Use
Mixed Sector (non-FLAG, cross-sector)Absolute4.20%Scope 1+2 default; non-FLAG Scope 3
FLAG Sector ApproachAbsolute3.03%Diversified FLAG footprints; long tail
FLAG Commodity — DairyIntensity3.10%Dairy processors; raw milk ≥10% of FLAG
FLAG Commodity — BeefIntensity2.40%Beef ≥10% of FLAG
FLAG Commodity — PorkIntensity3.30%Pork ≥10% of FLAG
FLAG Commodity — ChickenIntensity3.90%Chicken ≥10% of FLAG
FLAG Commodity — Palm OilIntensity3.10%Oils & fats, confectionery, bakery
FLAG Commodity — SoyIntensity3.80%Plant-based, oils & fats, feed-linked
FLAG Commodity — WheatIntensity3.60%Bakery, milling, cereals, beverages
FLAG Commodity — MaizeIntensity3.50%Starch & sweetener; bakery, beverages
FLAG Commodity — RiceIntensity2.90%Rice milling and processors
FLAG Commodity — LeatherIntensity2.50%Meat by-product / tannery operations

Note: Commodity rates are intensity-convergence rates (fresh-weight basis; FPCM for dairy). Actual targets depend on starting intensity, production growth and sourcing geography — the SBTi FLAG Tool performs the conversion. Source: SBTi FLAG Guidance V1.2 (March 2026), Table 8.

So a typical food and beverage company runs the 4.20%/yr cross-sector pathway on Scope 1+2 (with 80%/100% renewable electricity), and a FLAG target on each input above the 10% trigger — from 2.40%/yr (beef) to 3.90%/yr (chicken) — plus the 3.03%/yr FLAG sector pathway for the diversified remainder. Both are validated to 1.5°C, both are published, and both must be delivered to retain a valid SBTi commitment.

The Pathways Report

Cost the energy-and-industry side of your target.

The companion Pathways report carries the lever catalogue, the five-KPI screening matrix and two worked case studies with full financing math — everything needed to build the costed portfolio behind the energy-and-industry half of an SBTi target.

Get the Pathways Report →Explore TerraNova
More in the Food Decarb Series

The full Pathways report  ·  Food Decarb Series index  ·  Decarb Series (Pulp & Paper)

Koorosh Behrang
Written by

Koorosh Behrang

Founder, Climate Decode · Industrial Decarbonization & Carbon Markets

Founder of Climate Decode with more than 10 years across decarbonization strategy, corporate sustainability, Net Zero target setting, and compliance carbon markets. Leads the development of TerraNova — Climate Decode's platform for emissions baselines, marginal abatement cost curves, and finance-grade project economics.

Meet the team →
References & Sources

Where each claim comes from

This briefing reflects SBTi rules current to mid-2026. The primary sources below are authoritative.

  1. SBTi — Corporate Net-Zero Standard (Annex B; Sections 4.3.3 and C11)
  2. SBTi — FLAG Guidance V1.2 (March 2026), Table 8
  3. SBTi — FLAG Tool (commodity-to-absolute conversion)
  4. Accountability Framework initiative — deforestation cutoff guidance
  5. European Commission — EU Deforestation Regulation (EUDR)

Connect your target to a costed delivery plan.

TerraNova builds the emissions inventory, the marginal abatement cost curve and the finance-grade project portfolio behind the energy-and-industry half of a food company's science-based target.