A 7-minute summary of our full white paper — six decarbonization levers, two case studies, and a sneak peek at the financing math that decides which projects actually get built.
Policy and markets — not technology choice or headline carbon price — decide which pulp & paper decarbonization projects clear an investment committee.
Three things worth knowing
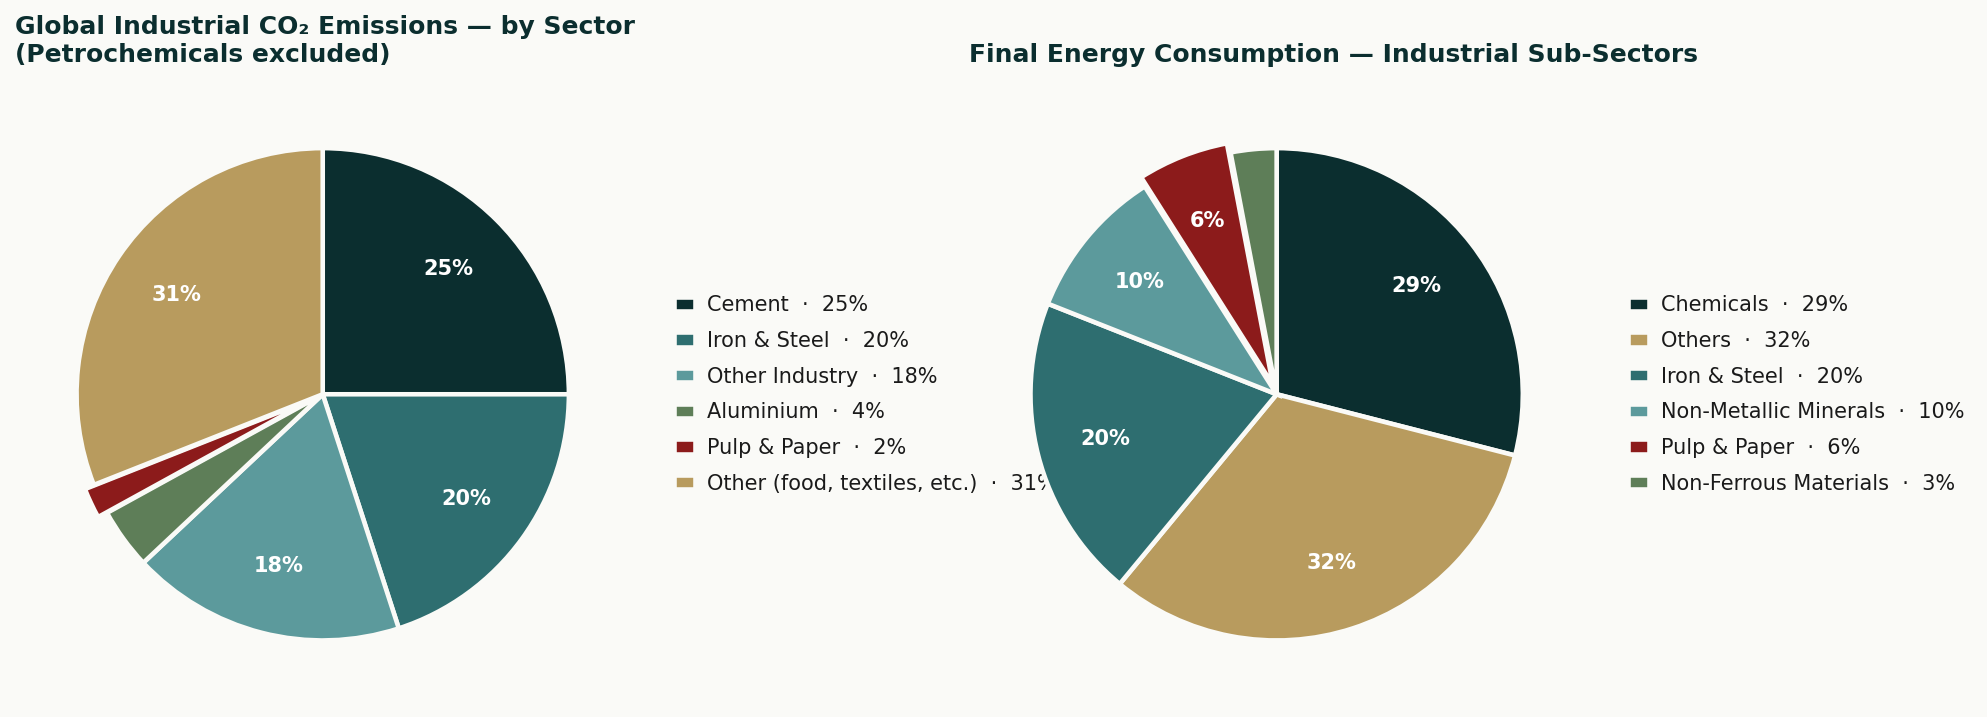
Pulp & paper consumes ~6% of global industrial energy but produces only ~2% of industrial CO₂. The gap is the biogenic fuel base — also the foundation for engineered negative emissions through BECCS.
Carbon pricing and government support do most of the work in turning a project from below break-even to investable. No single instrument usually carries the project alone.
The binding constraint is not the technology and not the headline carbon price — it is how readable the full policy stack is to a capital-allocation committee.
Geography note
The case studies use Canadian instruments (OBPS, CFR, CCUS ITC). The framework — layered MAC build-up, capital vs. revenue-side incentives, multi-year stack readability — applies just as cleanly under EU ETS, UK ETS, U.S. Section 45Q / Section 45Z, and California Cap-and-Trade. The numbers shift in magnitude, not in shape.
Sector
State of the Pulp & Paper Sector
Pulp & paper produced ~401 Mt of paper and paperboard in 2024, with 189 Mt of wood pulp. The sector's defining feature for decarbonization is the gap between energy use and emissions: roughly 6% of global industrial energy, but only ~2% of industrial CO₂. The reason is the biogenic fuel base — black liquor, bark, and biomass supply two-thirds or more of mill steam, combusting to CO₂ not counted as fossil under the GHG Protocol. The flip side: the sector emits over half a billion tonnes per year of biogenic CO₂ globally, the world's most accessible feedstock for engineered negative emissions.
Figure 1. Industrial CO₂ emissions (left) and final energy consumption (right) by sector. The pulp & paper gap is the biogenic fuel base.
Reference Mill
Where the Emissions Sit
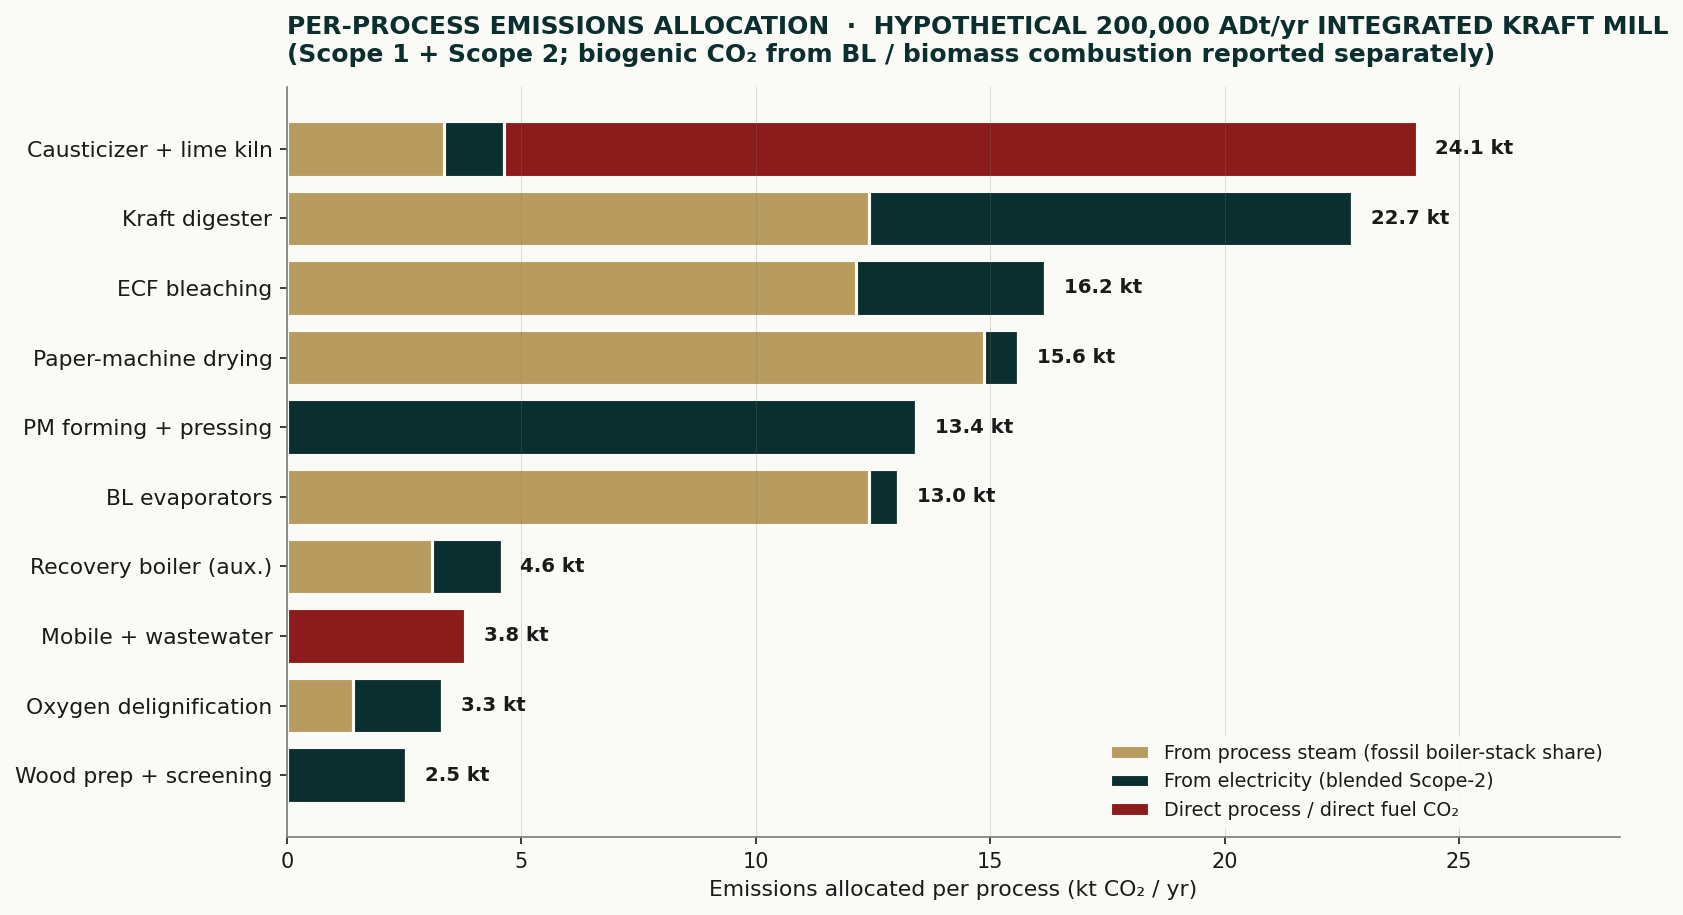
To anchor everything that follows in concrete numbers, we use a hypothetical 200,000 ADt/yr integrated kraft mill. Steam comes from three boilers: recovery (black liquor, ~50%, biogenic), bark/biomass (~22%, biogenic), and a natural-gas package boiler (~28%) where most fossil Scope-1 originates. The lime kiln burns gas directly.
Together the NG package boiler and lime kiln account for ~85% of fossil Scope-1 — about 70 ktCO₂/yr. Grid electricity adds ~20 ktCO₂/yr of Scope-2 at a typical North American factor; up to 50–60 kt in fossil-heavy grids.
Figure 2. Per-process fossil emissions allocation at the reference mill, split into steam-derived, electricity-derived, and direct contributions.
The story the chart tells
Every fossil tonne flows through one of two mill-level loads — boiler steam and grid electricity — plus the standalone lime-kiln load. Solutions act on these three load-relief mechanisms.
Toolkit
Decarbonization Solutions
Six families of solutions are available to a mill operator today. Here’s the one-line view of each — the full lever catalogue, sequencing logic, and per-lever capex/IRR sensitivities are unpacked in the white paper.
Energy efficiency — heat recovery, closed dryer hoods, shoe presses, VFDs, EMS. Cuts mill-wide energy 15–25%, mostly negative MAC.
Fuel switching — RNG, on-site biogas, LignoBoost, hydrogen for the lime kiln. Moderate–high capex; flips negative with CFR + ITC.
Electrification — industrial heat pumps (COP 4–6), MVR on evaporators (COP 8–15), electric boilers where the grid is clean.
Process innovation — black-liquor gasification, borate auto-causticizing. Deployed only at the 30–50-year replacement cycle.
BECCS — amine capture on biogenic flue gas. Verified removals monetized on voluntary markets; very high capex.
Recycled fibre — cuts upstream pulping energy ~60% on the substituted fraction. Low–moderate capex.
Family
MAC orientation (pre-policy)
Policy-stack dependence
Energy efficiency
Mostly negative
Low — clears on fundamentals
Fuel switching
Positive; flips negative with CFR + ITC
High
Electrification
Depends on electricity / NG price ratio
Moderate
Process innovation
Uneconomic outside replacement cycle
Moderate
BECCS
Strongly positive; flips with full stack
Very high
Recycled fibre
Mostly negative on upstream energy
Low
Sneak Peek · What’s in the White Paper
Six lever families, capex bands, and the sequencing logic that makes them stack.
The white paper unpacks each family with capex ranges, IRR sensitivities, real-asset case anchors, and the IEA sector pathway to 2050 — plus the full operations-to-financials methodology behind the two case studies you’re about to read.
The marginal abatement cost of any single lever, taken in isolation, is rarely the number that decides whether a project gets built. What decides it is the stack the mill can layer onto the technology — compliance pricing, capital incentives, fuel-side credits, voluntary offtakes, and fuel-cost savings. Two cases from the white paper make this concrete:
Case Study #1 — BECCS at the Recovery and Biomass Boilers
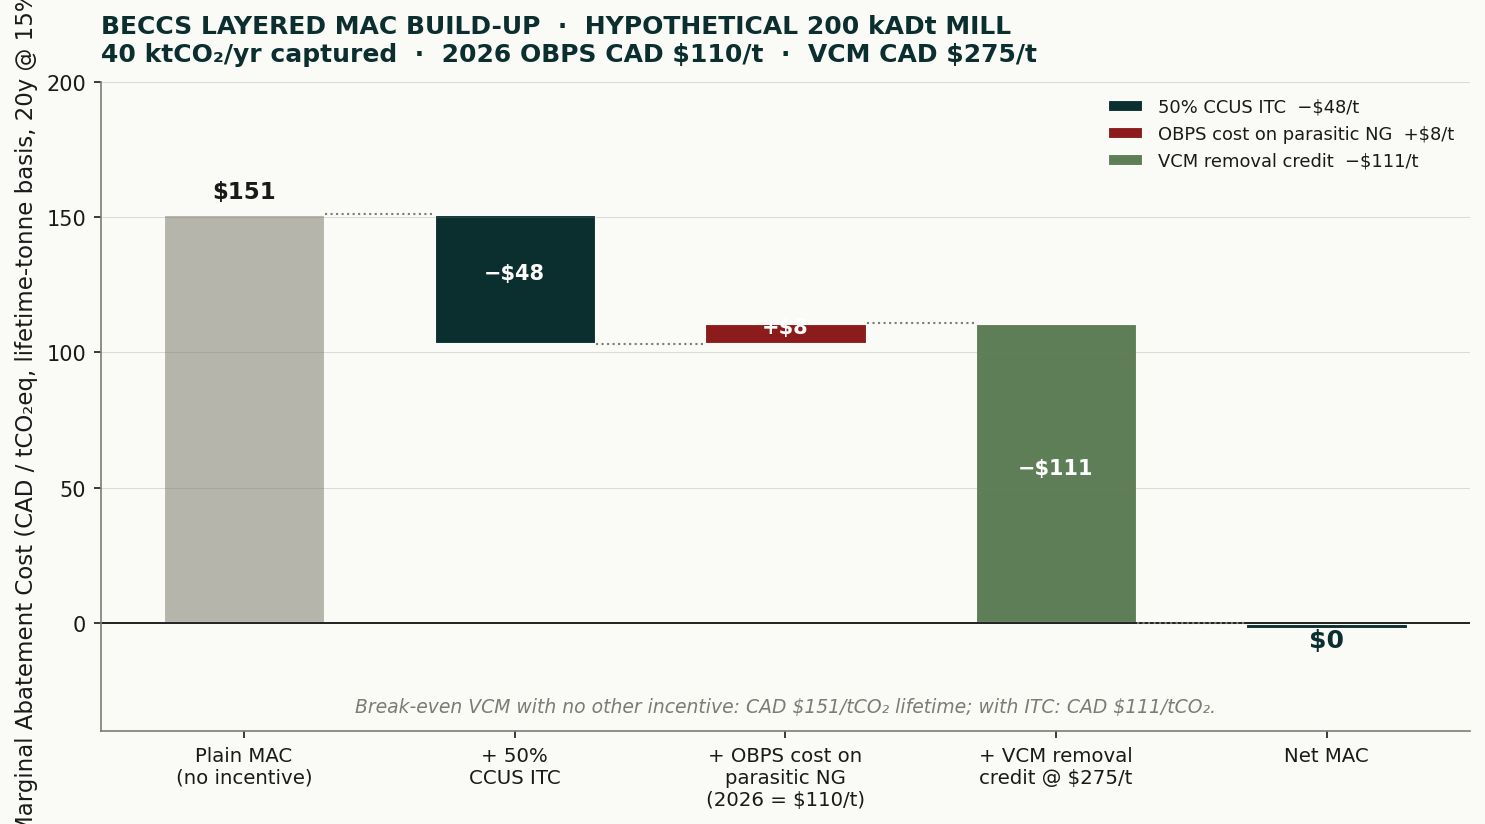
Amine post-combustion capture on the combined biogenic flue gas captures ~40,000 tCO₂/yr. The unsubsidized plain MAC is ~CAD $151/tCO₂. The 50% CCUS ITC takes it to $103/t. A long-dated voluntary-removal offtake at CAD $275/tCO₂ takes it to roughly break-even. The project clears only when three layers stack simultaneously: the CCUS ITC, the offtake, and a unified flue-gas configuration that eliminates OBPS exposure on parasitic NG.
Figure 3. BECCS layered MAC build-up (lifetime-tonne basis, 20y @ 15%). Plain MAC CAD $151/t becomes Net MAC ≈ $0/t once the 50% CCUS ITC and a CAD $275/t voluntary-removal offtake are stacked.
Why all three matter
Strip away any one layer and the project does not get built. The white paper walks the full sensitivity table, including what happens to the IRR if the credit price drops below $275/tCO₂ mid-contract.
Case Study #2 — On-Site Biogas at the Package Boiler
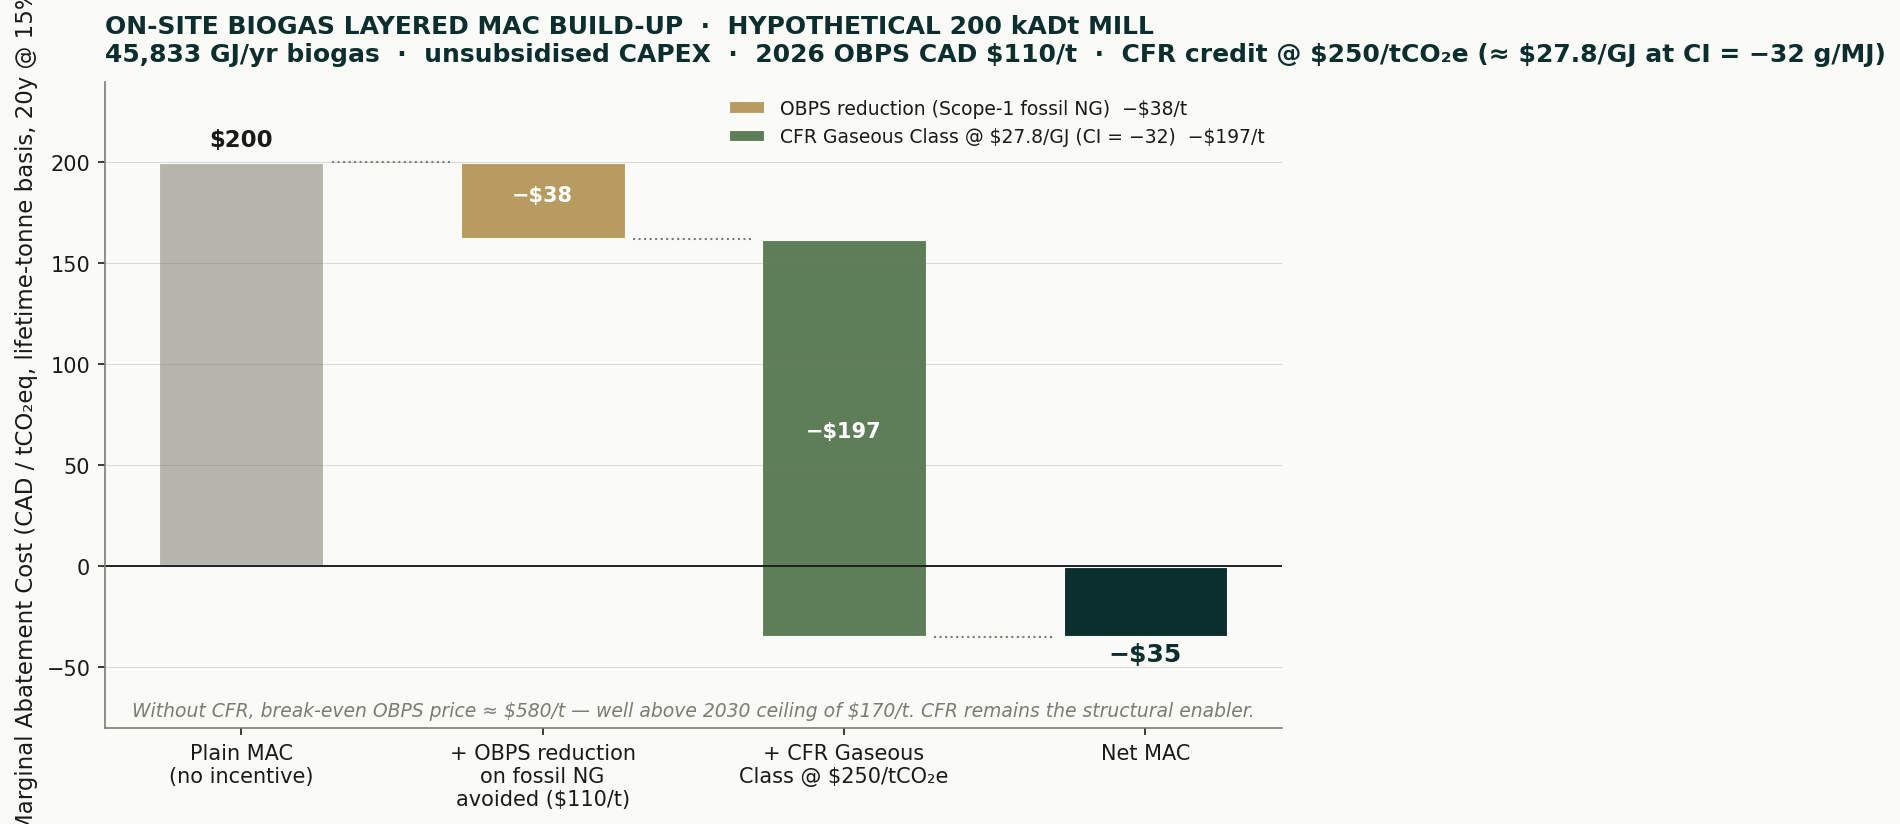
An anaerobic digester processes mill sludge plus co-substrates, producing ~45,800 GJ/yr of biogas that displaces fossil NG one-for-one and abates ~2,011 tCO₂/yr. The unsubsidized plain MAC is CAD $200/tCO₂. With OBPS savings (−$38/t) and CFR Gaseous Class credits at CAD $250/tCO₂e generating CAD $1.27M/yr, the Net MAC swings to approximately CAD −$35/tCO₂.
Figure 4. On-site biogas layered MAC build-up. Plain MAC CAD $200/t becomes Net MAC ≈ −$35/t once OBPS savings and CFR Gaseous Class revenue are stacked. Without CFR, the project does not clear at any legislated OBPS price.
CFR is the master switch
Carbon intensity is the master variable, set by feedstock choice; the full feedstock-by-CI sensitivity table (default through deep-negative source-separated organics) lives in the white paper.
White Paper
That’s the headline — the math is in the white paper
Every sensitivity walked through line-by-line: CFR price elasticity, ITC step-down timing, OBPS exposure scenarios, the feedstock-by-CI table for biogas, and the three structural fragilities these cases reveal about industrial decarbonization more broadly.
The bottleneck to greenlighting a decarbonization project is rarely the technology and rarely the headline carbon-price level. It is the multi-year readability of the full revenue stack to an investment committee at year zero and again at year ten.
Four things to take away
Deploy negative-MAC energy efficiency under any policy scenario — don’t wait for carbon-price clarity.
For BECCS: lock the 50% CCUS ITC pre-step-down, secure a long-dated voluntary-removal offtake at CAD $275+/tCO₂, and design around a unified flue-gas configuration.
For on-site biogas: invest in a registered CFR Gaseous Class pathway with a verified deep-negative CI — feedstock choice is the highest-leverage decision.
Stack revenue layers in the financial model up front: OBPS, ITCs, CFR, voluntary offtakes, fuel-cost savings, provincial top-ups.
Founder of Climate Decode with more than 10 years across decarbonization strategy, corporate sustainability, Net Zero target setting, and compliance carbon markets. Leads the development of TerraNova — Climate Decode's platform for emissions baselines, marginal abatement cost curves, and finance-grade project economics.
You’ve had the summary. Now get the full white paper.
Ten figures, the full lever catalogue, layered MAC build-ups for both cases, the feedstock-by-CI sensitivity table, the structural-fragility analysis, and the complete operations-to-financials methodology. Free, gated only by an email.